iPython Profiler
IPython provides access to a wide range of functions to measure times and create profiles. The following magic IPython commands are explained here:
Command |
Description |
|---|---|
|
Time to execute a single statement |
|
Average time it took to execute a single statement repeatedly |
|
Run code with the profiler |
|
Run code with the line-by-line profiler |
|
Measure the memory usage of a single statement |
|
Executes the code with the line-by-line memory profiler |
The last four commands are not contained in IPython itself, but in the modules line_profiler and memory_profiler.
See also:
%timeit and %time
We saw the %timeit line and %%timeit cell magic in the introduction of the magic functions in IPython magic commands. They can be used to measure the timing of the repeated execution of code snippets:
[1]:
%timeit sum(range(100))
326 ns ± 0.613 ns per loop (mean ± std. dev. of 7 runs, 1,000,000 loops each)
Note that %timeit executes the execution multiple times in a loop. If the number of loops is not specified with -n, %timeit automatically adjusts the number so that sufficient measurement accuracy is achieved:
[2]:
%%timeit
total = 0
for i in range(1000):
    for j in range(1000):
        total += i * (-1) ** j
70.9 ms ± 633 μs per loop (mean ± std. dev. of 7 runs, 10 loops each)
Sometimes repeating an operation is not the best option, for example when we have a list that we want to sort. Here we may be misled by repeated surgery. Sorting a presorted list is much faster than sorting an unsorted list, so repeating it distorts the result:
[3]:
import random


ls = [random.random() for i in range(100000)]
%timeit ls.sort()
225 μs ± 882 ns per loop (mean ± std. dev. of 7 runs, 1,000 loops each)
Then the %time function might be a better choice. %time should also be the better choice for long-running commands, when short system-related delays are unlikely to affect the result:
[4]:
import random


ls = [random.random() for i in range(100000)]
%time ls.sort()
CPU times: user 10.7 ms, sys: 658 μs, total: 11.3 ms
Wall time: 11.7 ms
Sorting an already sorted list:
[5]:
%time ls.sort()
CPU times: user 566 μs, sys: 0 ns, total: 566 μs
Wall time: 567 μs
Note how much faster the pre-sorted list is to be sorted, but also note how much longer the timing with %time takes compared to %timeit, even for the pre-sorted list. This is due to the fact that %timeit is doing some clever things to keep system calls from interfering with the timing. This prevents, for example, the garbage collection of Python objects that are no longer used and that could otherwise affect the time measurement. Because of this, the %timeit results are usually
noticeably faster than the %time results.
Profiling for scripts: %prun
A program is made up of many individual instructions, and sometimes it is more important to measure those instructions in context than to measure them yourself. Python includes a built-in Code-Profiler. However, IPython offers a much more convenient way to use this profiler in the form of the magic function %prun.
As an example, let’s define a simple function that does some calculations:
[6]:
def sum_of_lists(n):
    total = 0
    for i in range(5):
        ls = [j ^ (j >> i) for j in range(n)]
        total += sum(ls)
    return total
[7]:
%prun sum_of_lists(1000000)
         737 function calls (721 primitive calls) in 0.224 seconds

   Ordered by: internal time

   ncalls  tottime  percall  cumtime  percall filename:lineno(function)
      4/1    0.094    0.024    0.000    0.000 {method 'control' of 'select.kqueue' objects}
       14    0.051    0.004    0.060    0.004 socket.py:626(send)
        5    0.020    0.004    0.020    0.004 {built-in method builtins.sum}
        1    0.016    0.016    0.020    0.020 74316826.py:1(sum_of_lists)
        2    0.006    0.003    0.047    0.024 socket.py:703(send_multipart)
        2    0.006    0.003    0.006    0.003 {method '__exit__' of 'sqlite3.Connection' objects}
        1    0.006    0.006    0.006    0.006 {method 'send' of '_socket.socket' objects}
        1    0.006    0.006    0.091    0.091 asyncio.py:200(_handle_events)
        1    0.006    0.006    0.012    0.012 history.py:55(only_when_enabled)
        2    0.006    0.003    0.006    0.003 {method 'recv' of '_socket.socket' objects}
        1    0.005    0.005    0.025    0.025 <string>:1(<module>)
        5    0.000    0.000    0.000    0.000 attrsettr.py:66(_get_attr_opt)
       15    0.000    0.000    0.000    0.000 enum.py:1581(__or__)
        5    0.000    0.000    0.199    0.040 base_events.py:1947(_run_once)
        1    0.000    0.000    0.000    0.000 {method 'disable' of '_lsprof.Profiler' objects}
      8/5    0.000    0.000    0.091    0.018 {method 'run' of '_contextvars.Context' objects}
  146/142    0.000    0.000    0.000    0.000 {built-in method builtins.isinstance}
       66    0.000    0.000    0.000    0.000 enum.py:1574(_get_value)
        2    0.000    0.000    0.066    0.033 iostream.py:278(_really_send)
      4/1    0.000    0.000    0.000    0.000 selectors.py:540(select)
       29    0.000    0.000    0.000    0.000 enum.py:691(__call__)
        5    0.000    0.000    0.000    0.000 attrsettr.py:43(__getattr__)
        2    0.000    0.000    0.000    0.000 socket.py:774(recv_multipart)
        1    0.000    0.000    0.000    0.000 {method 'execute' of 'sqlite3.Connection' objects}
        1    0.000    0.000    0.006    0.006 selector_events.py:129(_read_from_self)
       29    0.000    0.000    0.000    0.000 enum.py:1145(__new__)
      8/5    0.000    0.000    0.091    0.018 events.py:87(_run)
        7    0.000    0.000    0.000    0.000 enum.py:1592(__and__)
        3    0.000    0.000    0.000    0.000 iostream.py:718(_rotate_buffers)
        3    0.000    0.000    0.000    0.000 queue.py:115(empty)
        1    0.000    0.000    0.000    0.000 inspect.py:3116(_bind)
        6    0.000    0.000    0.000    0.000 typing.py:426(inner)
        3    0.000    0.000    0.000    0.000 {built-in method _heapq.heappop}
        2    0.000    0.000    0.085    0.042 iostream.py:157(_handle_event)
        3    0.000    0.000    0.000    0.000 zmqstream.py:663(_rebuild_io_state)
        1    0.000    0.000    0.006    0.006 history.py:833(_writeout_input_cache)
        1    0.000    0.000    0.006    0.006 futures.py:393(_call_set_state)
        3    0.000    0.000    0.000    0.000 zmqstream.py:686(_update_handler)
        2    0.000    0.000    0.085    0.042 zmqstream.py:583(_handle_events)
        1    0.000    0.000    0.006    0.006 history.py:845(writeout_cache)
        8    0.000    0.000    0.000    0.000 base_events.py:768(time)
        2    0.000    0.000    0.085    0.042 zmqstream.py:556(_run_callback)
        3    0.000    0.000    0.000    0.000 iostream.py:616(_flush)
        1    0.000    0.000    0.006    0.006 kernelbase.py:302(poll_control_queue)
        3    0.000    0.000    0.000    0.000 iostream.py:710(_flush_buffers)
        1    0.000    0.000    0.025    0.025 {built-in method builtins.exec}
        1    0.000    0.000    0.000    0.000 asyncio.py:225(add_callback)
        3    0.000    0.000    0.000    0.000 base_events.py:848(_call_soon)
        1    0.000    0.000    0.006    0.006 _base.py:337(_invoke_callbacks)
        5    0.000    0.000    0.000    0.000 <frozen importlib._bootstrap>:1390(_handle_fromlist)
        1    0.000    0.000    0.000    0.000 queues.py:209(put_nowait)
        1    0.000    0.000    0.000    0.000 queues.py:225(get)
        4    0.000    0.000    0.000    0.000 ioloop.py:742(_run_callback)
        6    0.000    0.000    0.000    0.000 traitlets.py:676(__get__)
        2    0.000    0.000    0.000    0.000 traitlets.py:718(_validate)
        1    0.000    0.000    0.000    0.000 decorator.py:199(fix)
        1    0.000    0.000    0.006    0.006 _base.py:537(set_result)
       10    0.000    0.000    0.000    0.000 {built-in method builtins.hasattr}
        1    0.000    0.000    0.000    0.000 traitlets.py:1527(_notify_observers)
        2    0.000    0.000    0.085    0.042 zmqstream.py:624(_handle_recv)
        1    0.000    0.000    0.000    0.000 inspect.py:2930(apply_defaults)
        3    0.000    0.000    0.000    0.000 events.py:36(__init__)
        2    0.000    0.000    0.000    0.000 typing.py:1665(__subclasscheck__)
        1    0.000    0.000    0.000    0.000 inspect.py:3255(bind)
        5    0.000    0.000    0.000    0.000 {built-in method builtins.getattr}
       20    0.000    0.000    0.000    0.000 {built-in method builtins.len}
        2    0.000    0.000    0.000    0.000 traitlets.py:689(set)
        2    0.000    0.000    0.000    0.000 traitlets.py:3631(set)
        1    0.000    0.000    0.012    0.012 decorator.py:229(fun)
        2    0.000    0.000    0.066    0.033 iostream.py:276(<lambda>)
        2    0.000    0.000    0.000    0.000 traitlets.py:3474(validate)
        3    0.000    0.000    0.000    0.000 threading.py:303(__enter__)
        1    0.000    0.000    0.006    0.006 selector_events.py:141(_write_to_self)
        2    0.000    0.000    0.000    0.000 traitlets.py:727(_cross_validate)
        6    0.000    0.000    0.000    0.000 traitlets.py:629(get)
        1    0.000    0.000    0.000    0.000 queues.py:186(put)
        5    0.000    0.000    0.000    0.000 selector_events.py:740(_process_events)
        2    0.000    0.000    0.000    0.000 typing.py:1374(__instancecheck__)
        1    0.000    0.000    0.000    0.000 queues.py:256(get_nowait)
        3    0.000    0.000    0.000    0.000 events.py:129(__lt__)
       11    0.000    0.000    0.000    0.000 {method 'popleft' of 'collections.deque' objects}
        2    0.000    0.000    0.000    0.000 traitlets.py:3624(validate_elements)
        2    0.000    0.000    0.000    0.000 queues.py:322(_consume_expired)
        4    0.000    0.000    0.000    0.000 typing.py:1443(__hash__)
        2    0.000    0.000    0.000    0.000 base_events.py:819(call_soon)
       10    0.000    0.000    0.000    0.000 {method 'append' of 'collections.deque' objects}
        1    0.000    0.000    0.000    0.000 traitlets.py:1512(_notify_trait)
        3    0.000    0.000    0.000    0.000 queue.py:267(_qsize)
        2    0.000    0.000    0.000    0.000 iostream.py:213(_is_master_process)
        6    0.000    0.000    0.000    0.000 {built-in method builtins.next}
        8    0.000    0.000    0.000    0.000 {built-in method time.monotonic}
        1    0.000    0.000    0.000    0.000 concurrent.py:182(future_set_result_unless_cancelled)
        1    0.000    0.000    0.006    0.006 base_events.py:872(call_soon_threadsafe)
        1    0.000    0.000    0.000    0.000 traitlets.py:1523(notify_change)
        1    0.000    0.000    0.000    0.000 threading.py:315(_acquire_restore)
        2    0.000    0.000    0.000    0.000 <frozen abc>:121(__subclasscheck__)
        3    0.000    0.000    0.000    0.000 zmqstream.py:542(sending)
       24    0.000    0.000    0.000    0.000 typing.py:2366(cast)
        1    0.000    0.000    0.000    0.000 inspect.py:2877(args)
        7    0.000    0.000    0.000    0.000 {method '__exit__' of '_thread.lock' objects}
        3    0.000    0.000    0.000    0.000 threading.py:306(__exit__)
        2    0.000    0.000    0.000    0.000 {method 'set_result' of '_asyncio.Future' objects}
        2    0.000    0.000    0.000    0.000 {built-in method builtins.issubclass}
        2    0.000    0.000    0.000    0.000 traitlets.py:708(__set__)
        2    0.000    0.000    0.000    0.000 traitlets.py:2304(validate)
        2    0.000    0.000    0.000    0.000 {built-in method _abc._abc_subclasscheck}
        1    0.000    0.000    0.000    0.000 history.py:839(_writeout_output_cache)
        1    0.000    0.000    0.000    0.000 threading.py:428(notify_all)
        1    0.000    0.000    0.000    0.000 threading.py:398(notify)
        5    0.000    0.000    0.000    0.000 {method 'upper' of 'str' objects}
        1    0.000    0.000    0.000    0.000 threading.py:631(clear)
        5    0.000    0.000    0.000    0.000 {method 'append' of 'list' objects}
        5    0.000    0.000    0.000    0.000 {method 'get' of 'dict' objects}
        5    0.000    0.000    0.000    0.000 {built-in method builtins.max}
        1    0.000    0.000    0.000    0.000 queues.py:317(__put_internal)
        1    0.000    0.000    0.000    0.000 queues.py:312(_put)
        1    0.000    0.000    0.000    0.000 threading.py:312(_release_save)
        1    0.000    0.000    0.000    0.000 {built-in method _thread.allocate_lock}
        3    0.000    0.000    0.000    0.000 {method 'acquire' of '_thread.lock' objects}
        1    0.000    0.000    0.000    0.000 {built-in method posix.getppid}
        2    0.000    0.000    0.000    0.000 iostream.py:216(_check_mp_mode)
        5    0.000    0.000    0.000    0.000 zmqstream.py:538(receiving)
        1    0.000    0.000    0.000    0.000 inspect.py:2900(kwargs)
        4    0.000    0.000    0.000    0.000 {method '__exit__' of '_thread.RLock' objects}
        1    0.000    0.000    0.000    0.000 base_events.py:1932(_add_callback)
        3    0.000    0.000    0.000    0.000 {method 'items' of 'dict' objects}
        1    0.000    0.000    0.000    0.000 {method '__enter__' of '_thread.RLock' objects}
        2    0.000    0.000    0.000    0.000 traitlets.py:3486(validate_elements)
       10    0.000    0.000    0.000    0.000 inspect.py:2787(kind)
        1    0.000    0.000    0.000    0.000 {method 'values' of 'mappingproxy' objects}
        3    0.000    0.000    0.000    0.000 {method 'items' of 'mappingproxy' objects}
        4    0.000    0.000    0.000    0.000 {built-in method builtins.hash}
        2    0.000    0.000    0.000    0.000 {built-in method posix.getpid}
        1    0.000    0.000    0.000    0.000 queues.py:173(qsize)
        2    0.000    0.000    0.000    0.000 {built-in method builtins.iter}
        2    0.000    0.000    0.000    0.000 {method 'extend' of 'list' objects}
        1    0.000    0.000    0.000    0.000 zmqstream.py:694(<lambda>)
        5    0.000    0.000    0.000    0.000 base_events.py:2045(get_debug)
        3    0.000    0.000    0.000    0.000 base_events.py:550(_check_closed)
        1    0.000    0.000    0.000    0.000 unix_events.py:83(_process_self_data)
        1    0.000    0.000    0.000    0.000 threading.py:318(_is_owned)
        4    0.000    0.000    0.000    0.000 inspect.py:2775(name)
        2    0.000    0.000    0.000    0.000 {method '__enter__' of '_thread.lock' objects}
        1    0.000    0.000    0.000    0.000 queues.py:309(_get)
        4    0.000    0.000    0.000    0.000 inspect.py:3070(parameters)
        1    0.000    0.000    0.000    0.000 {method 'done' of '_asyncio.Future' objects}
        2    0.000    0.000    0.000    0.000 {built-in method _contextvars.copy_context}
        2    0.000    0.000    0.000    0.000 {method 'cancelled' of '_asyncio.Future' objects}
        2    0.000    0.000    0.000    0.000 iostream.py:255(closed)
        1    0.000    0.000    0.000    0.000 base_events.py:754(is_closed)
        1    0.000    0.000    0.000    0.000 {built-in method _asyncio.get_running_loop}
        1    0.000    0.000    0.000    0.000 queues.py:177(empty)
        1    0.000    0.000    0.000    0.000 {method 'release' of '_thread.lock' objects}
        1    0.000    0.000    0.000    0.000 {method '_is_owned' of '_thread.RLock' objects}
        1    0.000    0.000    0.000    0.000 inspect.py:2869(__init__)
        1    0.000    0.000    0.000    0.000 locks.py:224(clear)
        1    0.000    0.000    0.000    0.000 queues.py:59(_set_timeout)
In the notebook the output looks something like this:
14 function calls in 9.597 seconds

   Ordered by: internal time

   ncalls  tottime  percall  cumtime  percall filename:lineno(function)
        5    8.121    1.624    8.121    1.624 <ipython-input-15-f105717832a2>:4(<listcomp>)
        5    0.747    0.149    0.747    0.149 {built-in method builtins.sum}
        1    0.665    0.665    9.533    9.533 <ipython-input-15-f105717832a2>:1(sum_of_lists)
        1    0.065    0.065    9.597    9.597 <string>:1(<module>)
        1    0.000    0.000    9.597    9.597 {built-in method builtins.exec}
        1    0.000    0.000    0.000    0.000 {method 'disable' of '_lsprof.Profiler' objects}
The result is a table that shows the execution time for each function call, sorted by total time. In this case, most of the time is consumed with list comprehension within sum_of_lists. This gives us clues as to where we could improve the efficiency of the algorithm.
Profiling line by line: %lprun
Profiling with %prun is useful, but sometimes a line-by-line profile report is more insightful. This isn’t built into Python or IPython, but there is a package available, line_profiler, that enables this. This can be provided in your kernel with
$ spack env activate python-374
$ spack install py-line-profiler ^python@3.7.4%gcc@9.1.0
Alternatively, you can install line-profiler with other package managers, for example
$ uv add line_profiler
Now you can load IPython with the line_profiler extension:
[8]:
%load_ext line_profiler
The %lprun command profiles each function line by line. In this case, you must explicitly specify which functions are of interest for creating the profile:
[9]:
%lprun -f sum_of_lists sum_of_lists(5000)
Timer unit: 1e-09 s

Total time: 0.000987 s
File: /var/folders/hk/s8m0bblj0g10hw885gld52mc0000gn/T/ipykernel_28626/74316826.py
Function: sum_of_lists at line 1

Line #      Hits         Time  Per Hit   % Time  Line Contents
==============================================================
     1                                           def sum_of_lists(n):
     2         1       1000.0   1000.0      0.1      total = 0
     3         6       2000.0    333.3      0.2      for i in range(5):
     4         5     920000.0 184000.0     93.2          ls = [j ^ (j >> i) for j in range(n)]
     5         5      63000.0  12600.0      6.4          total += sum(ls)
     6         1       1000.0   1000.0      0.1      return total
The result looks something like this:
Timer unit: 1e-06 s

Total time: 0.015145 s
File: <ipython-input-6-f105717832a2>
Function: sum_of_lists at line 1

Line #      Hits         Time  Per Hit   % Time  Line Contents
==============================================================
     1                                           def sum_of_lists(N):
     2         1          1.0      1.0      0.0      total = 0
     3         6         11.0      1.8      0.1      for i in range(5):
     4         5      14804.0   2960.8     97.7          L = [j ^ (j >> i) for j in range(N)]
     5         5        329.0     65.8      2.2          total += sum(L)
     6         1          0.0      0.0      0.0      return total
The time is given in microseconds and we can see which line the function spends most of its time on. We may then be able to modify the script in such a way that the efficiency of the function can be increased.
More information about %lprun and the available options can be found in the IPython help function %lprun?.
Create a storage profile: %memit and %mprun
Another aspect of profiling is the amount of memory that an operation uses. This can be evaluated with another IPython extension, the memory_profiler. This can be provided in your kernel with
$ spack env activate python-311
$ spack install py-memory-profiler
Alternatively you can install memory-profiler with other package managers, for example
$ uv add memory_profiler
[10]:
%load_ext memory_profiler
[11]:
%memit sum_of_lists(1000000)
peak memory: 198.78 MiB, increment: 71.50 MiB
We see that this feature occupies approximately 100 MB of memory.
For a line-by-line description of memory usage, we can use the %mprun magic. Unfortunately, this magic only works for functions that are defined in separate modules and not for the notebook itself. So we first use the %%file magic to create a simple module called mprun_demo.py that contains our sum_of_lists function.
[12]:
%%file mprun_demo.py
from memory_profiler import profile

@profile
def my_func():
    a = [1] * (10 ** 6)
    b = [2] * (2 * 10 ** 7)
    del b
    return a

%mprun -f my_func my_func()
Writing mprun_demo.py
Here the Increment column shows how much each row affects the total memory consumption: Note that when we calculate b we need about 160 MB of additional memory; however, this is not released again by deleting b.
More information about %memit, %mprun and their options can be found in the IPython help with %memit?.
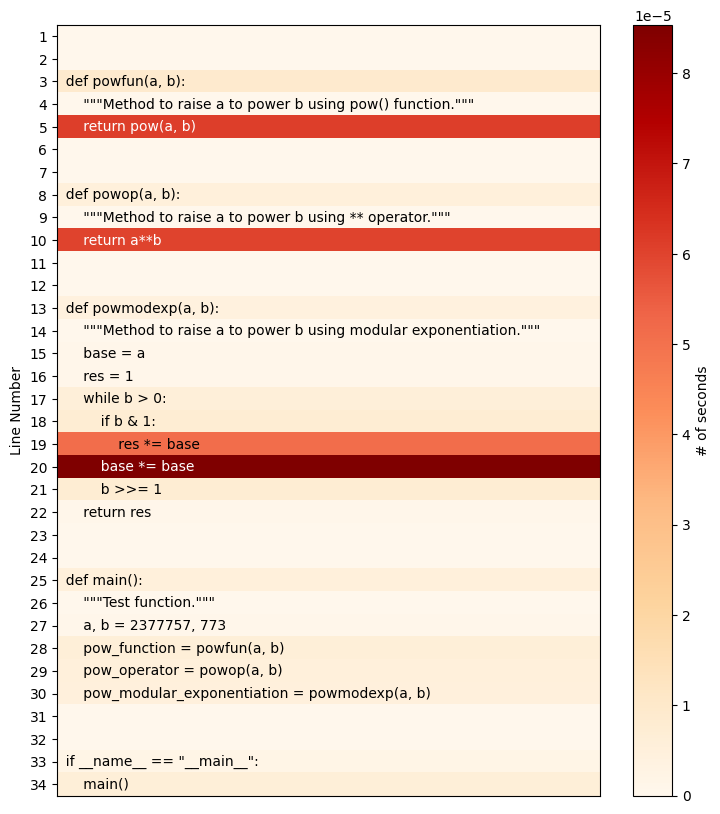
pyheatmagic
pyheatmagic is an extension that allows the IPython magic command %%heat to display Python code as a heatmap with Py-Heat.
It can be easily installed in the kernel with
$ uv add py-heat-magic
Installing py-heat-magic…
…
Loading the extension in IPython
[13]:
%load_ext heat
Display the heat map
[14]:
%%heat


def powfun(a, b):
    """Method to raise a to power b using pow() function."""
    return pow(a, b)


def powop(a, b):
    """Method to raise a to power b using ** operator."""
    return a**b


def powmodexp(a, b):
    """Method to raise a to power b using modular exponentiation."""
    base = a
    res = 1
    while b > 0:
        if b & 1:
            res *= base
        base *= base
        b >>= 1
    return res


def main():
    """Test function."""
    a, b = 2377757, 773
    pow_function = powfun(a, b)
    pow_operator = powop(a, b)
    pow_modular_exponentiation = powmodexp(a, b)


if __name__ == "__main__":
    main()
/Users/veit/cusy/trn/jupyter-tutorial/uvenvs/py313/.venv/lib/python3.13/site-packages/pyheat/pyheat.py:158: UserWarning: set_ticklabels() should only be used with a fixed number of ticks, i.e. after set_ticks() or using a FixedLocator.
  self.ax.set_yticklabels(row_labels, minor=False)
Alternatively, the heatmap can also be saved as a file, for example with
%%heat -o pow-heatmap.png